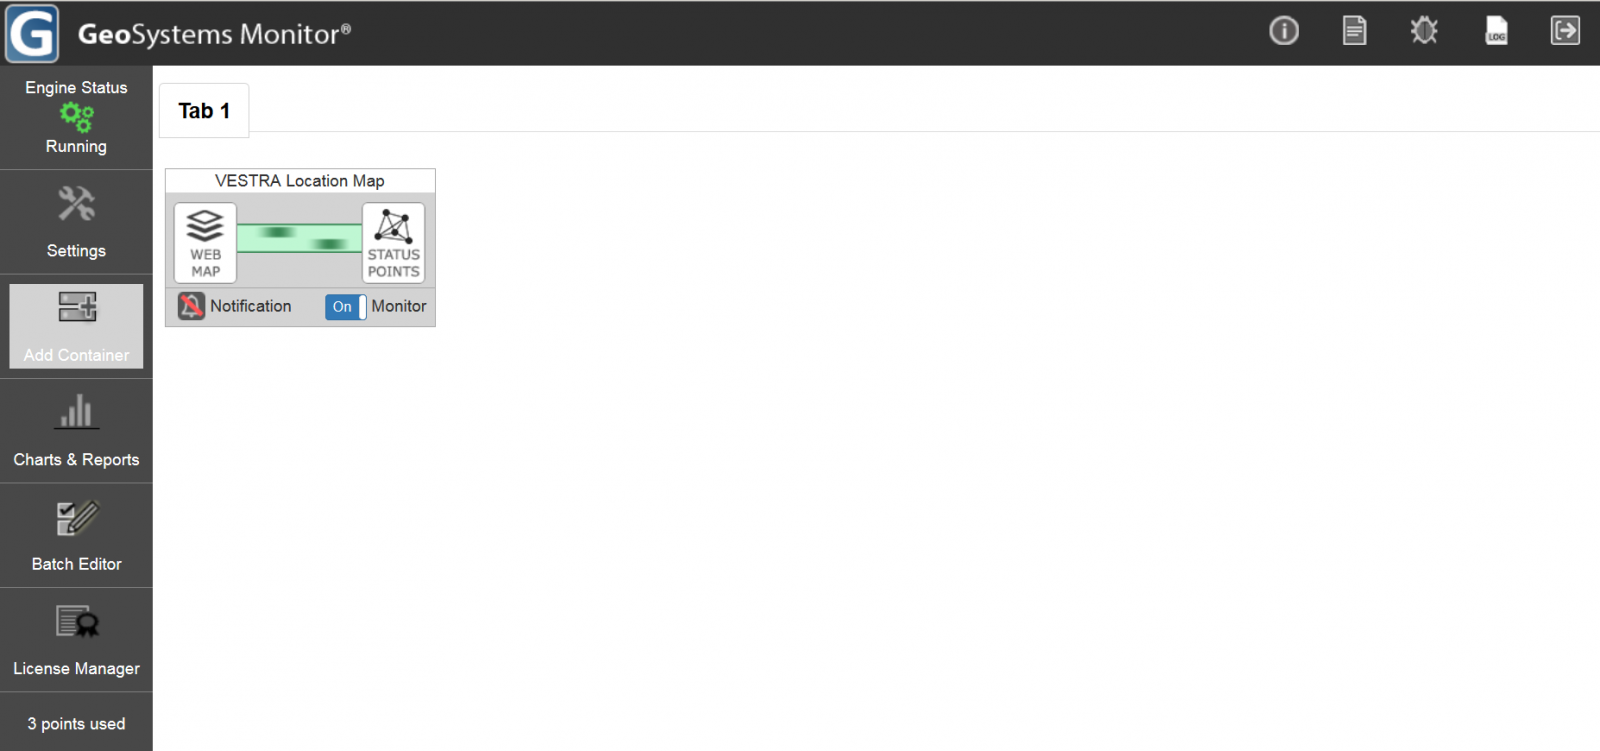
Left Menu/Icons
- Engine Status Icon - Shows the status of the engine that runs the GeoSystems Monitor. Make sure that it is Running. If it is not, it will display as Stopped.


- Settings - Will open up all of the Settings options (see: 'Settings' documentation)
- Add Container - See documentation on how to add containers and monitoring points.
- Charts & Reports - See documentation on how to create charts and reports
- Batch Editor - See documentation on using the batch editor
- License Manager - See documentation on monitoring the license manager
Number of points used - This displays directly under the upper left menu/icon items. It will display the number of points you've currently used within all containers and is used for licensing purposes
Upper Right Menu/Icons
 About - Will display information about your installed version of GeoSystems Monitor (such as, which version and how many days are left of your license).
 Documentation -
 Debuging - Will perform debugging on monitored services. Click icon to turn on/off. When it's on, it will display in green (
 ).
). Log Files - Will display the log files for debugging mode (if enabled).
 Log Out - Will log out the current logged in user.
Dashboard Display/Arrangement
|
As new containers are created they will appear on the tab next to the sample container, where they can be dragged and ordered as desired with the mouse. Additional tabs can be created in Settings - Tabs, by clicking on the <New Tab> button. The arrangement of containers and tabs can be customized to your organization. For example, you could place all containers related to a single department on a tab. Another possibility is placing the containers that experience has shown are more likely to reveal issues on the first tab, so that they can be quickly identified. |
|
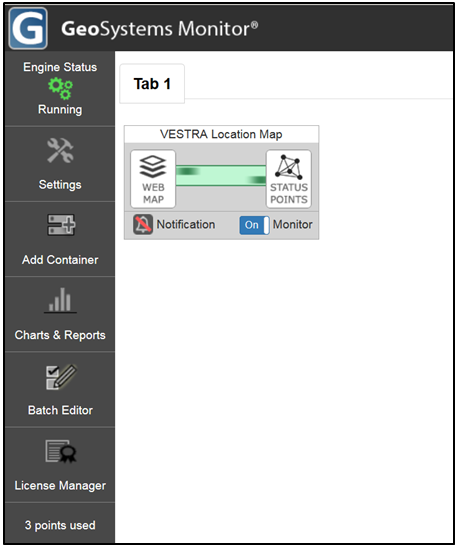

If you would like to move a container to a different tab, open the container panel for editing by clicking on the Web Map or Application icon to the left of the container, and select the new tab from the drop down box there. The number of tabs and containers that can be created is not restricted, but it is recommended to keep the number of containers on a single tab limited, so that any down points can be spotted at a glance.
If a monitoring point goes down, a number of color indicators will appear in order to draw attention to it. The 'running container' animation will go from green to red, and a circular badge will appear to the top right of the container with the number of down points, also colored red. In addition, the tab will change to red to draw attention to the tab. If the point is merely slow, the color indicator is yellow. See image above.